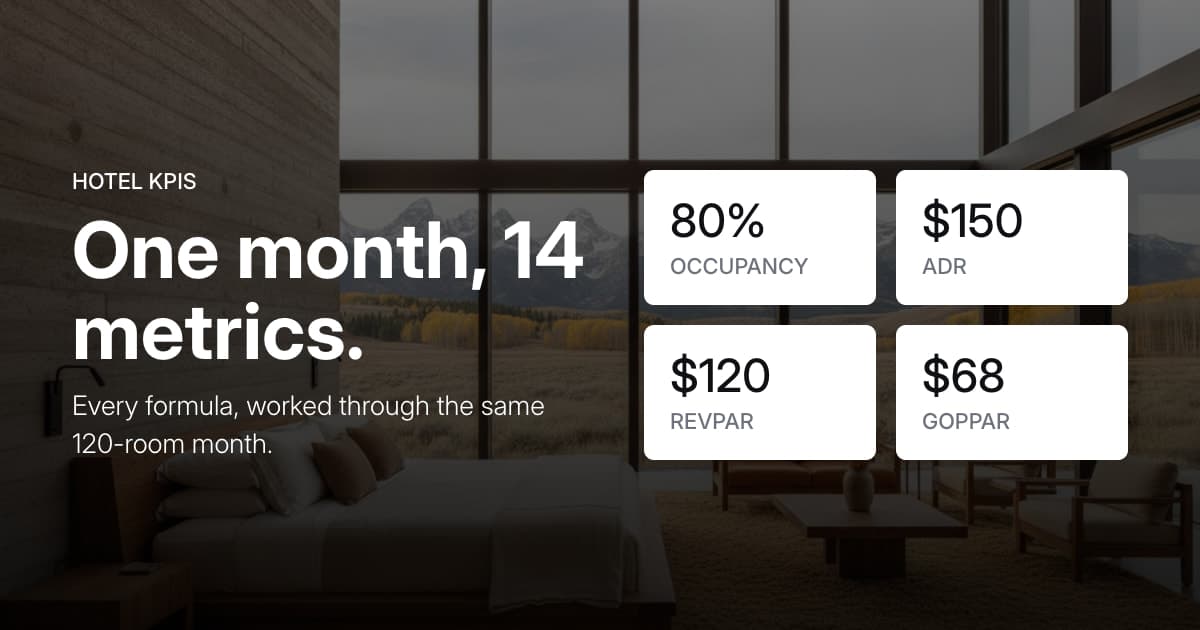
Every metric on this page is worked through the same property, so the numbers connect instead of floating free. Picture a 120-room hotel looking back at a 30-night month:
- 120 rooms across 30 nights, so 3,600 available room-nights
- 2,880 room-nights sold, from 1,200 bookings taken and 240 cancelled
- $432,000 in room revenue, plus $180,000 from the restaurant, spa, and parking
- $367,200 in operating expenses, of which $172,800 was the cost of servicing rooms
- A competitive set that ran 76% full at a $132.00 average rate
That single month is enough to produce all fourteen numbers below. If you'd rather put your own figures in, the RevPAR calculator sits inline further down.
Room revenue metrics.
The three everyone quotes, and the three most often confused for each other.
1. Occupancy rate
How full you ran. It's the only one of the three with no price in it.
Occupancy = Rooms sold / Available room-nights
2,880 / 3,600 = 80%
Because occupancy carries no price, you can always buy more of it by charging less, which is why it's the easiest number to feel good about and the easiest to be misled by. A property that holds rate at 70% and $180.00 earns more per available room than one that discounts to 90% at $130.00.
The denominator is where mistakes happen. It counts every room for every night, not just the nights you were trying to sell. More detail in occupancy rate, or run your own figures through the occupancy calculator.
2. Average daily rate (ADR)
What you actually charged the guests who came.
ADR = Room revenue / Rooms sold
$432,000 / 2,880 = $150.00
ADR ignores empty rooms entirely, so a quiet month at a high rate looks excellent. Keep food, beverage, spa, and resort fees out of the numerator, and take complimentary rooms out of both halves. See average daily rate, or use the ADR calculator.
3. RevPAR
What every room you owned earned, whether it sold or not.
RevPAR = Room revenue / Available room-nights
$432,000 / 3,600 = $120.00

Or: ADR x Occupancy = $150.00 x 80% = $120.00
RevPAR is the one that notices both halves of the month, which is why it's the industry's default scoreboard. Its blind spot is everything that isn't a room. Full detail in revenue per available room.
Put your own month in:
RevPAR
$120.00
$432,000.00 room revenue ÷ 3,600 available room-nights
- ADR
- $150.00
- Occupancy
- 80.0%
Profitability metrics.
Revenue metrics can all rise while the business gets worse. These are the ones that catch it.
4. TRevPAR
Total revenue per available room, so every department counts.
TRevPAR = Total revenue / Available room-nights
($432,000 + $180,000) / 3,600 = $170.00
The $50.00 gap between TRevPAR and RevPAR is what the restaurant, spa, and parking contributed per available room. Comparing a full-service hotel to a limited-service one on RevPAR alone understates the first one badly. See total revenue per available room.
5. GOPPAR
Gross operating profit per available room. The closest of the common metrics to real profitability.
GOPPAR = (Total revenue - Operating expenses) / Available room-nights
($612,000 - $367,200) / 3,600 = $68.00
This is the number that notices cost. A property can lift RevPAR by buying occupancy through discounted OTA channels and watch GOPPAR fall, because the commission and the labor of servicing more rooms ate the gain. Two properties with identical RevPAR can be very different businesses. See GOPPAR.
6. Cost per occupied room (CPOR)
What it costs to service one sold room for one night.
CPOR = Rooms department costs / Rooms sold
$172,800 / 2,880 = $60.00
CPOR is where your rate floor actually sits. A discounted room that still clears $60.00 contributes something; one that doesn't costs money to accept. See cost per occupied room.
7. Flow-through
How much of a revenue gain survived to the bottom line.
Flow-through = Change in GOP / Change in total revenue
If revenue grew $50,000 and gross operating profit grew $20,000, flow-through is 40%. Anything under about 30% usually means the extra revenue arrived through an expensive channel or needed expensive labor to service.
Benchmarking metrics.
Absolute numbers tell you what season it is. These tell you whether you're winning.
8. RevPAR Index (RGI)
Your RevPAR against your competitive set.
RGI = (Your RevPAR / Comp set RevPAR) x 100
($120.00 / $100.00) x 100 = 120
100 means you captured exactly your fair share. Our property took 20% more per available room than its comp set. This is the metric that survives a bad market: RevPAR falling 10% while the set falls 15% is a share gain. See RevPAR Index.
9. Market Penetration Index (MPI)
The occupancy version of the same idea.
MPI = (Your occupancy / Comp set occupancy) x 100
(80% / 76%) x 100 = 105
10. Average Rate Index (ARI)
And the rate version.
ARI = (Your ADR / Comp set ADR) x 100
($150.00 / $132.00) x 100 = 114
These three fit together, which is what makes them useful as a set. MPI multiplied by ARI, divided by 100, gets you back to RGI: 105 x 114 / 100 is about 120. That tells you how you won your share. This property beat its market slightly on volume and substantially on rate, which is the healthier of the two ways to do it.
Demand and booking metrics.
Where the business came from, and what it cost you to get.
11. Average length of stay (ALOS)
ALOS = Room-nights sold / Number of bookings
2,880 / 960 = 3.0 nights
Longer stays are cheaper per night to run, because one arrival, one departure, and one deep clean spread across more nights. That's why accepting a lower nightly rate for a longer booking can still leave you ahead. See average length of stay.
12. Booking window
The average days between booking and arrival. Our property books 34 days out.
A shortening window means guests are waiting, which usually means they expect a discount for waiting. A lengthening one gives you more room to hold rate. It's the earliest warning sign in this list, because it moves before occupancy does.
13. Cancellation rate
Cancellation rate = Cancelled bookings / Total bookings
240 / 1,200 = 20%
Cancellations quietly wreck forecasts, since a 20% rate means your on-the-books number is meaningfully softer than it looks. Worth tracking by channel, because OTA bookings usually cancel at a very different rate to direct ones.
14. Direct booking share
Direct share = Direct room-nights / Total room-nights sold
1,152 / 2,880 = 40%
The one on this list with the most upside. At a 15% commission, moving 5% of 2,880 room-nights from an OTA to your own site is worth roughly $3,240 in a single month, straight to the bottom line, with no extra rooms sold and no rate change. It shows up in GOPPAR rather than RevPAR, which is exactly why RevPAR-only reporting hides it.
Guest satisfaction.
Guest satisfaction sits upstream of everything above it. Review score and search rank drive the traffic that fills the rooms in the first place.
Our property sits at 4.6 stars with an NPS of 52. The operational number underneath both is response time, because how fast a guest gets an answer moves review scores more reliably than almost anything else you can control. Private post-stay surveys catch the problems before they become public ones, and reputation tools handle what's already out there.
The whole set at a glance.
| Metric | Formula | Our month |
|---|---|---|
| Occupancy | Rooms sold / available room-nights | 80% |
| ADR | Room revenue / rooms sold | $150.00 |
| RevPAR | Room revenue / available room-nights | $120.00 |
| TRevPAR | Total revenue / available room-nights | $170.00 |
| GOPPAR | Gross operating profit / available room-nights | $68.00 |
| CPOR | Rooms dept costs / rooms sold | $60.00 |
| Flow-through | Change in GOP / change in revenue | 40% |
| RGI | (Your RevPAR / comp RevPAR) x 100 | 120 |
| MPI | (Your occupancy / comp occupancy) x 100 | 105 |
| ARI | (Your ADR / comp ADR) x 100 | 114 |
| ALOS | Room-nights / bookings | 3.0 nights |
| Booking window | Average days booking to arrival | 34 days |
| Cancellation rate | Cancelled / total bookings | 20% |
| Direct share | Direct room-nights / total room-nights | 40% |
Which of these actually matter.
Fourteen metrics is a reference list, not a dashboard. Tracking all of them weekly is how a revenue meeting turns into a recital.
A workable split: RevPAR and RGI weekly, because they tell you whether you're winning and they move fast enough to act on. GOPPAR monthly, once expenses close, because it's the only one that answers whether the month was actually profitable. Booking window and direct share monthly as leading indicators, since both move before revenue does and both are things you can influence directly.
The rest are diagnostics. You reach for CPOR when you're arguing about a rate floor, ALOS when you're setting stay restrictions, and ARI against MPI when you want to know whether you won on rate or on volume.
For short-term rentals the arithmetic is identical with unit-nights in place of room-nights. The one thing that changes is availability: owner stays, seasonal closures, and a listing that was only live for part of the month all have to come out of the denominator, or occupancy reads artificially low.
Getting the numbers without the spreadsheet.
Most of this arithmetic already exists in your PMS; the work is pulling it out and lining it up. Akia is plugged into your property management system, so your team can ask her where the month landed instead of exporting it. Ask Akia answers from live occupancy, rate, and room revenue, and she'll tell whoever asks, not just whoever has the reporting login.
And a note on the metric most worth moving: direct booking share responds faster than the others, because it doesn't need a single extra room sold to show up in profit.